
Lines (areas) and support and resistance areas are technical analysis keywords that understand the concepts, and practical use of them seems necessary for all market participants. In this article, we try to introduce these concepts and explain how to obtain resistance lines and support lines.
Since resistance and support are related to more basic concepts, to understand them, it is necessary first to explain the relevant concepts in simple language to get to the point.
What is Technical Analysis?
Technical analysis, in simple terms, is the study of the price behavior of a financial asset such as securities or a cryptocurrency such as bitcoin over some time as well as its forecast. There are factors to focus on in technical analysis: time, price, and market psychological factors. When the pattern of price movement in a market is significantly repeated, investors who realize this sooner than others can benefit more from the market average with their strategies.
Technical analysis helps us be more successful than others and be equipped with appropriate tools in this field by using tools such as charts (bar, candle), indicators, indicators, etc.
Candlestick Chart
This chart is fantastic for technicians! The candlestick chart is similar to the bar chart, except that the areas between the open price and the close price are colored to show the market’s overall movement over time. The candlestick chart shows the price movement in specific periods. Each candlestick is drawn based on four prices: Open price, Last price or Close price, High price, Low price.
If the market moves upwards over time and is called a bullish market, the distance between the two prices is green, and if it moves downwards and is called a bearish, the area between the two prices is shown. The candle diagram is drawn in red. Of course, instead of the two colors, green and red, the two colors, white and black, are also used to show the upward and downward market, respectively.

Cryptocurrencys Support
Time Frame
Depending on the investment you are making, you can use different time frames for technical analysis. For example, if you trade daily and want to take advantage of cryptocurrency market fluctuations, you can check the market price at intervals of 30 minutes, one hour, or 4 hours.
On the other hand, if you are a long-term trader and you are waiting for the market to move towards your buy and sell order range, then you can analyze the price behavior to find a recurring pattern over the day or month.
Trend Line
As you monitor market movement, you may find patterns and prices that show up in your chart. One of the unique formulations of a chart is the Trend line. The trend is related to market psychology; That is, it shows the general feeling of the market, including fear, greed, expectations, etc.
When the price of a cryptocurrency is rising in the chart, it means that market agents and brokers feel good about that cryptocurrency and buy it. This will intensify the upward movement of prices.
The importance of the process lies in the fact that if you can recognize it, you have made a profit or avoided a loss. Some trends are easy to spot. For example, between July and December 2017, there was a considerable uptrend in the Bitcoin market and some other cryptocurrencies, so that a continuous and clear uptrend was visible. But trend recognition is not always easy, and it can be said that drawing a trend line is an art.
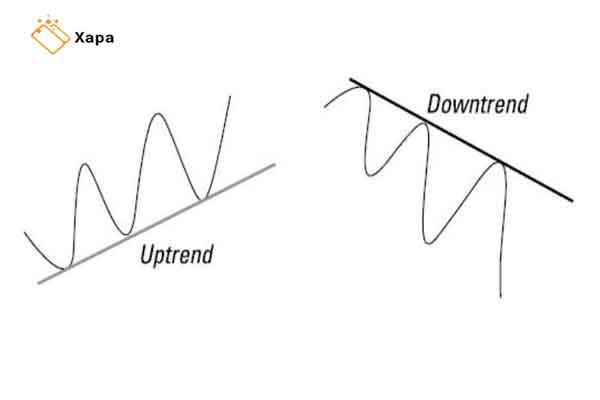
The primary method is proposed to draw the trend line, both ascending and descending:
Once you have identified a momentum or price acceleration in the uptrend chart, connect the valleys or minimum price points to chart an uptrend. To draw a downward trend, connect the peaks or maximum points.
Support lines
The support line is a barrier to the price that does not allow it to go below. This level is always at the bottom of the current market price chart. People who recognize a support level or line expect to buy cryptocurrency at this price level. One of the most common ways to detect a resistance line is to examine cryptocurrency’s past performance on the chart. It is important to note that a price level can be a level or line of resistance at any given time in which price reductions can be prevented.
In the support line, price reductions are prevented by increasing demand. Buyers are likely to call everyone who looks appropriate if there are only a few. Therefore, increasing demand contains price reductions.
As you can see in the image below, one of the essential bitcoin resistance lines was created at a price of around $ 6,000. During 2017 and 2018, the price of Bitcoin went down several times, but each time the resistance line prevented the price from falling. Note that in this article, reference to the resistance price level is approximate. In principal resistances, resistance occurs in a range rather than exactly a particular price level, rather than we have a price level.
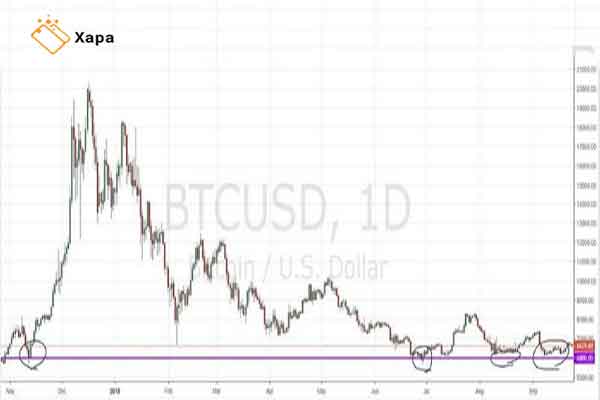
Each time a resistance level or line is exposed to a price attack to break, it becomes stronger. But after solid support is broken, the market sentiment moves in a direction that continues to decline and move to the following support line.
Supports, displayed in lines or ranges, actually identify areas where the traded asset is in high demand, and there are no sellers at prices below the support levels. Also, in resistance lines or ranges, the market is saturated with the supply of traded assets, and the so-called buyers’ order is lower than the resistance. The following chart, which is related to Bitcoin, shows the support and resistance ranges:
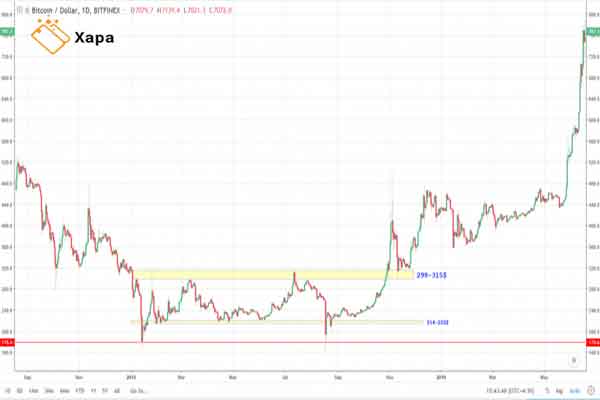
BTC / USD chart
This chart showed the price changes of Bitcoin in 2015. The $ 298 to $ 315 range in 2015 was a substantial resistance range for Bitcoin; Bitcoin tried several times to cross this range this year and failed. Also, in the same year, the $ 214 to $ 220 range for Bitcoin played a significant support range, as the price was volatile after the break, and there was strong demand for it.
After breaking the resistance range on October 30, 2015, the price of Bitcoin stabilized on the resistance range, and the large yellow spectrum, which had played a resistance role for Bitcoin for ten months, became a new support range, and the price fell. In November 2015, it was below this range. After breaking the main resistance range, the long-term uptrend of bitcoin began. As mentioned in the previous sections, traders usually consider the closing price of each candlestick and determine the support and resistance levels according to this price and confirm the support and resistance failure.
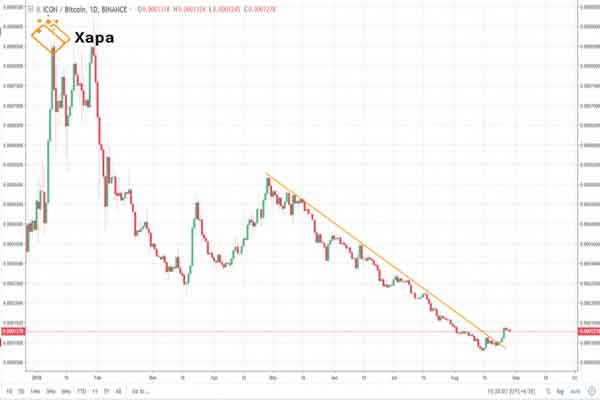
ICX / BTC chart
In this chart, you can see the ICX / BTC currency pair trend line, which lasted from late April to August 2018. The icon has tried several times to break the downtrend line, but each time failed until it broke the downtrend line in late August and experienced relatively significant growth for the next few weeks.
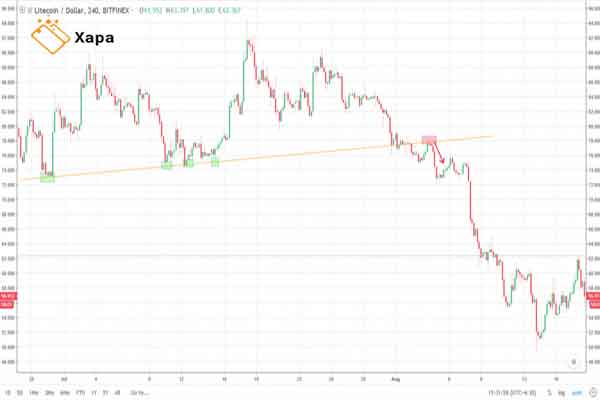
LTC / USD chart
This chart shows Litecoin from late June to early August 2018. The support formed in early August broke and caused Litecoin to leave the medium-term uptrend. After Light back to the uptrend line, Litecoin is in a downtrend. Pull Back: The last time, the price returns to these lines after breaking the support and resistance lines and continues its new trend after failing to break it again.
Identify and draw support lines and resistance lines
There are several ways to identify and draw support lines and resistance lines:
Round Numbers
A simple way to identify resistance and support lines is to look at the Round Numbers. Behavioral economics findings empirically show that rand numbers can be considered barriers to price movement. Of course, the definition of rand number in different markets can be different. For example, we can point to the resistance of the dollar price to 20 thousand and recently 30 thousand tomans in the domestic foreign exchange market.
20-80 Rule
This is not a formal rule, but looking at price charts can show its relative accuracy. This rule states that if there are supposed to be 500 resistance lines, the price will be 480 or 520.
Pay Attention to the Past of a Chart.
Looking back at a chart can help us identify levels, especially when the approximate sequence of peaks or valleys was around a price level in the past. The greater the number of peaks and valleys in a price level, the greater the primary levels’ credibility.
Fibonacci Retracement
It is suggested that you use the Fibonacci retracement tool to identify resistance lines and support lines. By adding Fibonacci tools to a trend line on platforms, you can instantly see several levels of support and resistance; Extract it yourself one by one without the need.
Conclusion
This article tried to explain the importance of this analysis by mentioning its introductory concepts such as technical analysis, time frame, and trend line, using its specific tools. Levels or lines of resistance and support are among the essential images used to analyze all markets. Knowing these concepts is crucial to trading and investing in digital currencies.
In short, support is the level at which sellers reach more buyers. Resistance is also the level at which buyers face an increasing number of sellers. But trading is just one way to invest and make a profit in the cryptocurrencies market, and another popular way is to extract this digital asset. So if you want to make a profit in the cryptocurrency market by mining, we suggest you also read the article ” What is ASIC? “.


BenitoTeada
На этом ресурсе вы найдете учреждение психологического здоровья, которая обеспечивает психологические услуги для людей, страдающих от депрессии и других психических расстройств. Эта эффективные методы для восстановления психического здоровья. Врачи нашего центра готовы помочь вам решить трудности и вернуться к психологическому благополучию. Профессионализм наших специалистов подтверждена множеством положительных отзывов. Свяжитесь с нами уже сегодня, чтобы начать путь к восстановлению.
http://janetkwok.net/__media__/js/netsoltrademark.php?d=empathycenter.ru%2Farticles%2Fgemofobiya-boyazn-vida-krovi%2F
BenitoTeada
На этом ресурсе вы найдете учреждение ментального здоровья, которая обеспечивает профессиональную помощь для людей, страдающих от депрессии и других психологических расстройств. Наша индивидуальный подход для восстановления ментального здоровья. Наши специалисты готовы помочь вам решить трудности и вернуться к гармонии. Опыт наших специалистов подтверждена множеством положительных рекомендаций. Запишитесь с нами уже сегодня, чтобы начать путь к лучшей жизни.
http://letstalktransit.net/__media__/js/netsoltrademark.php?d=empathycenter.ru%2Farticles%2Fgemofobiya-boyazn-vida-krovi%2F
BenitoTeada
На этом ресурсе вы найдете учреждение ментального здоровья, которая предоставляет профессиональную помощь для людей, страдающих от депрессии и других психологических расстройств. Мы предлагаем индивидуальный подход для восстановления ментального здоровья. Врачи нашего центра готовы помочь вам справиться с трудности и вернуться к гармонии. Профессионализм наших психологов подтверждена множеством положительных отзывов. Обратитесь с нами уже сегодня, чтобы начать путь к восстановлению.
http://lightvc.net/__media__/js/netsoltrademark.php?d=empathycenter.ru%2Fpreparations%2Fm%2Fmelatonin%2F
avtoaibolit-76.ru
Мы предлагаем прокат автобусов и микроавтобусов с водителем большим организациям, малого и среднего бизнеса, а также частным заказчикам.
Автобус для мероприятий
Обеспечиваем максимально комфортную и спокойную транспортировку для групп людей, предоставляя заказы на торжества, деловые мероприятия, групповые экскурсии и все типы мероприятий в Челябинске и области.
JordanRah
Luxury timepieces have long been synonymous with precision. Meticulously designed by legendary brands, they combine tradition with innovation.
Each detail reflect superior quality, from precision-engineered calibers to luxurious finishes.
Owning a timepiece is a true statement of status. It represents sophisticated style and heritage craftsmanship.
Whether you prefer a minimalist aesthetic, Swiss watches offer extraordinary beauty that lasts for generations.
http://thirsty-party.de/gb/guestbook.php
JordanRah
Luxury timepieces have long been a benchmark of excellence. Meticulously designed by legendary brands, they seamlessly blend tradition with innovation.
Each detail embody exceptional workmanship, from precision-engineered calibers to luxurious elements.
Wearing a horological masterpiece is a true statement of status. It signifies refined taste and exceptional durability.
Whether you prefer a minimalist aesthetic, Swiss watches offer unparalleled reliability that stands the test of time.
http://lchv.net/lchvboard/viewtopic.php?f=1&t=12712
JordanRah
Luxury timepieces have long been a benchmark of excellence. Meticulously designed by world-class brands, they combine heritage with modern technology.
All elements reflect unmatched attention to detail, from intricate mechanisms to premium elements.
Investing in a timepiece is a true statement of status. It signifies refined taste and heritage craftsmanship.
No matter if you love a classic design, Swiss watches deliver remarkable beauty that lasts for generations.
http://www.craftsfaironline.com/cgi-bin/yabb/YaBB.pl?num=1743166349/0#0
JasonCOB
You can find a comprehensive collection of trusted healthcare solutions for various needs.
Our online pharmacy provides speedy and secure delivery right to your door.
All products comes from trusted suppliers so you get authenticity and compliance.
You can search through our catalog and get your medicines hassle-free.
If you have questions, Our support team are here to help at any time.
Prioritize your well-being with reliable e-pharmacy!
https://edmedic.bloggersdelight.dk/2024/09/30/hej-verden/
оформление сертификатов
Оформление сертификатов в нашей стране является неотъемлемым этапом выхода продукции на рынок.
Этот процесс гарантирует соответствие нормам и официальным требованиям, а это гарантирует защиту потребителей от небезопасной продукции.
сертификация качества продукции
К тому же, сертификация помогает деловые отношения с партнерами и повышает возможности на рынке.
Без сертификации, возможны штрафы и ограничения при продаже товаров.
Вот почему, оформление документации является не просто обязательным, но и важным фактором укрепления позиций бизнеса на отечественном рынке.
сертификация товаров
Оформление сертификатов в России остается неотъемлемым процессом легальной реализации товаров.
Этот процесс гарантирует полное соответствие государственным стандартам и законам, что защищает потребителей от фальсификата.
сертификация
Также сертификация помогает взаимодействие с партнерами и открывает конкурентные преимущества на рынке.
При отсутствии сертификатов, не исключены юридические риски и ограничения в процессе реализации продукции.
Вот почему, официальное подтверждение качества является не просто обязательным, но и важным фактором для успешного развития компании на отечественном рынке.
GeorgeJuire
Even with the rise of digital timepieces, classic wristwatches remain iconic.
Many people still appreciate the intricate design that goes into classic automatics.
Unlike smartwatches, which become outdated, mechanical watches stay relevant for decades.
https://rantcave.com/showthread.php?tid=19723&pid=111469#pid111469
Prestigious watchmakers still produce limited-edition mechanical models, showing that demand for them remains strong.
For many, a mechanical watch is not just a way to tell time, but a tribute to craftsmanship.
Even as high-tech wearables provide extra features, mechanical watches have soul that stands the test of time.
bs2best
Что такое BlackSprut?
Платформа BlackSprut привлекает интерес разных сообществ. Но что это такое?
Эта площадка обеспечивает широкие опции для тех, кто им интересуется. Оформление сайта выделяется простотой, что делает платформу доступной даже для новичков.
Стоит учитывать, что этот ресурс обладает уникальными характеристиками, которые формируют его имидж на рынке.
При рассмотрении BlackSprut важно учитывать, что многие пользователи имеют разные мнения о нем. Одни подчеркивают его удобство, а некоторые относятся к нему неоднозначно.
Таким образом, BlackSprut остается объектом интереса и вызывает внимание широкой аудитории.
Обновленный сайт БлэкСпрут – здесь можно найти
Если нужен обновленный домен BlackSprut, вы на верном пути.
bs2best актуальная ссылка
Сайт часто обновляет адреса, поэтому важно иметь обновленный линк.
Мы мониторим за изменениями и готовы поделиться актуальным зеркалом.
Проверьте актуальную ссылку у нас!
Juliocok
Ordering medicine from e-pharmacies is way more convenient than shopping in person.
No need to deal with crowds or think about closing times.
Internet drugstores allow you to order your medications from home.
Numerous platforms offer special deals unlike physical stores.
https://kaeng.go.th/forum/suggestion-box/253717-which-e-pharmacies-are-the-best
Additionally, you can compare various options easily.
Fast shipping makes it even more convenient.
What do you think about purchasing drugs from the internet?
чемпион слот официальный сайт
Любители азартных игр всегда могут найти зеркальное зеркало онлайн-казино Champion чтобы без проблем запустить популярными автоматами.
В казино можно найти самые топовые онлайн-игры, включая классические, и самые свежие автоматы от мировых брендов.
Если главный ресурс временно заблокирован, альтернативная ссылка даст возможность без проблем войти и делать ставки без перебоев.
казино чемпион зеркало
Все возможности полностью работают, начиная от создания аккаунта, пополнение счета и кэш-ауты, и, конечно, бонусную систему.
Заходите через проверенную альтернативный адрес, чтобы играть без ограничений!
Dennismat
Здесь вы можете найти интересные игровые слоты.
Мы собрали большой выбор аппаратов от проверенных студий.
Каждый слот отличается уникальной графикой, увлекательными бонусами и честными шансами на выигрыш.
http://latourdetoure.com/the-buzzing-landscape-of-online-casinos/
Каждый посетитель может тестировать автоматы без вложений или выигрывать настоящие призы.
Интерфейс максимально удобны, что облегчает поиск игр.
Для любителей онлайн-казино, данный ресурс стоит посетить.
Присоединяйтесь прямо сейчас — возможно, именно сегодня вам повезёт!
1xbet игровые автоматы
На этом сайте вы можете наслаждаться обширной коллекцией слотов.
Эти слоты славятся яркой графикой и интерактивным игровым процессом.
Каждая игра даёт индивидуальные бонусные функции, повышающие вероятность победы.
1xbet казино официальный сайт
Слоты созданы для любителей азартных игр всех мастей.
Вы можете играть бесплатно, после чего начать играть на реальные деньги.
Проверьте свою удачу и получите удовольствие от яркого мира слотов.
игровые автоматы vavada
Здесь представлены слоты платформы Vavada.
Каждый пользователь найдёт слот на свой вкус — от классических игр до видеослотов слотов с яркой графикой.
Казино Vavada предоставляет возможность сыграть в популярных игр, включая слоты с крупными выигрышами.
Любой автомат работает без ограничений и подходит как для компьютеров, так и для планшетов.
vavada casino
Вы сможете испытать настоящим драйвом, не выходя из дома.
Структура платформы понятна, что обеспечивает без труда начать играть.
Начните прямо сейчас, чтобы открыть для себя любимые слоты!
casino slots
On this platform, you can access a wide selection of casino slots from top providers.
Users can enjoy classic slots as well as modern video slots with vivid animation and bonus rounds.
If you’re just starting out or a casino enthusiast, there’s a game that fits your style.
slot casino
The games are ready to play round the clock and designed for PCs and smartphones alike.
No download is required, so you can get started without hassle.
The interface is easy to use, making it convenient to browse the collection.
Sign up today, and discover the world of online slots!
bs2best.markets
Сайт BlackSprut — это хорошо известная точек входа в даркнете, предлагающая разнообразные сервисы для пользователей.
На платформе предусмотрена понятная система, а визуальная часть понятен даже новичкам.
Участники выделяют быструю загрузку страниц и активное сообщество.
bs2 bsme
BlackSprut ориентирован на приватность и безопасность при использовании.
Тех, кто изучает теневые платформы, BlackSprut может стать хорошим примером.
Прежде чем начать не лишним будет прочитать основы сетевой безопасности.
MichealSnapy
This online service makes available a wide range of pharmaceuticals for online purchase.
Anyone can securely get health products without leaving home.
Our product list includes both common medications and targeted therapies.
The full range is acquired via trusted distributors.
https://community.alteryx.com/t5/user/viewprofilepage/user-id/577127
We prioritize quality and care, with encrypted transactions and timely service.
Whether you’re treating a cold, you’ll find safe products here.
Explore our selection today and enjoy stress-free healthcare delivery.
casino slots
This website, you can discover lots of casino slots from top providers.
Users can experience retro-style games as well as new-generation slots with stunning graphics and exciting features.
If you’re just starting out or an experienced player, there’s a game that fits your style.
casino games
Each title are ready to play anytime and optimized for desktop computers and mobile devices alike.
No download is required, so you can jump into the action right away.
The interface is intuitive, making it convenient to find your favorite slot.
Sign up today, and discover the excitement of spinning reels!
CharlesEsoro
Предстоящее лето обещает быть насыщенным и нестандартным в плане моды.
В тренде будут натуральные ткани и игра фактур.
Гамма оттенков включают в себя чистые базовые цвета, подчеркивающие индивидуальность.
Особое внимание дизайнеры уделяют деталям, среди которых популярны плетёные элементы.
https://ourclass.mn.co/posts/lepodium-agregator-luksovoi-mody-menyauschii-pravila-igry
Возвращаются в моду элементы нулевых, в свежем прочтении.
В новых коллекциях уже можно увидеть трендовые образы, которые впечатляют.
Не упустите шанс, чтобы чувствовать себя уверенно.
Michaelisory
На данном сайте вы сможете найти свежие новости Краснодара.
Здесь собраны главные новости города, репортажи и важные обновления.
Будьте в курсе развития событий и читайте только проверенные данные.
Если вам интересно, что нового в Краснодаре, читайте наш сайт регулярно!
https://rftimes.ru/
casino
This website, you can find lots of slot machines from top providers.
Users can experience classic slots as well as new-generation slots with high-quality visuals and interactive gameplay.
If you’re just starting out or an experienced player, there’s a game that fits your style.
money casino
The games are ready to play anytime and optimized for laptops and tablets alike.
You don’t need to install anything, so you can jump into the action right away.
Platform layout is easy to use, making it simple to explore new games.
Join the fun, and discover the excitement of spinning reels!
MichaelWek
Were you aware that 1 in 3 medication users commit preventable drug mistakes due to insufficient information?
Your wellbeing is your most valuable asset. Every medication decision you make significantly affects your body’s functionality. Staying educated about the drugs you take isn’t optional for disease prevention.
Your health goes far beyond swallowing medications. Each drug affects your biological systems in unique ways.
Remember these life-saving facts:
1. Combining medications can cause health emergencies
2. Over-the-counter pain relievers have serious risks
3. Self-adjusting treatment causes complications
To avoid risks, always:
✓ Verify interactions with professional help
✓ Study labels thoroughly when starting medical treatment
✓ Consult your doctor about correct dosage
___________________________________
For verified pharmaceutical advice, visit:
https://www.pinterest.com/pin/879609370963891997/
Jamesgab
This online pharmacy features a broad selection of pharmaceuticals with competitive pricing.
Shoppers will encounter various medicines to meet your health needs.
Our goal is to keep safe and effective medications while saving you money.
Fast and reliable shipping guarantees that your purchase gets to you quickly.
Enjoy the ease of ordering medications online through our service.
cenforce 200mg tablets
sonsofanarchy-italia.com
Questo sito rende possibile il reclutamento di lavoratori per compiti delicati.
Gli interessati possono trovare professionisti specializzati per operazioni isolate.
Le persone disponibili vengono verificati con attenzione.
assumere un killer
Sul sito è possibile ottenere informazioni dettagliate prima della scelta.
La professionalità resta al centro del nostro servizio.
Contattateci oggi stesso per trovare il supporto necessario!
casino
This website, you can access a wide selection of online slots from top providers.
Users can enjoy classic slots as well as new-generation slots with vivid animation and exciting features.
Whether you’re a beginner or an experienced player, there’s a game that fits your style.
casino slots
The games are ready to play round the clock and optimized for PCs and mobile devices alike.
You don’t need to install anything, so you can get started without hassle.
Platform layout is easy to use, making it simple to explore new games.
Join the fun, and enjoy the excitement of spinning reels!
hitman for hire
Searching for a person to take on a rare hazardous job?
Our platform specializes in linking customers with contractors who are ready to perform serious jobs.
Whether you’re dealing with emergency repairs, hazardous cleanups, or complex installations, you’re at the perfect place.
All available professional is vetted and qualified to ensure your safety.
rent a killer
This service offer clear pricing, detailed profiles, and secure payment methods.
Regardless of how challenging the scenario, our network has the expertise to get it done.
Start your search today and find the perfect candidate for your needs.
how to learn hacking
Here important data about techniques for turning into a digital intruder.
Content is delivered in a simple and understandable manner.
One can grasp a range of skills for entering systems.
In addition, there are real-life cases that demonstrate how to employ these capabilities.
how to become a hacker
The entire content is persistently upgraded to be in sync with the recent advancements in hacking techniques.
Extra care is paid to functional usage of the acquired knowledge.
Note that all operations should be executed responsibly and according to proper guidelines only.
WileyDeelT
This resource are presented useful bonus codes for online betting.
These bonuses give access to earn extra incentives when placing bets on the service.
Every listed promotional codes are always up-to-date to assure their relevance.
When using these promotions you can improve your gaming experience on the betting platform.
https://www.radio-rfe.com/content/pages/periodicheskie_proverki_zdaniy_chto_o_nih_nughno_znaty.html
Moreover, step-by-step directions on how to implement special offers are offered for ease of use.
Keep in mind that specific offers may have particular conditions, so look into conditions before redeeming.
StevenDor
Here you can obtain distinctive special offers for a renowned betting brand.
The variety of promotional offers is continuously improved to assure that you always have opportunity to use the fresh proposals.
Through these promotional deals, you can cut costs on your gambling ventures and improve your probability of victory.
All voucher codes are thoroughly verified for validity and performance before getting posted.
https://rajeman.com/pages/preimuschestva_lestnic_polok_v_sovremennom_interyere.html
Additionally, we present detailed instructions on how to use each special promotion to improve your benefits.
Bear in mind that some offers may have distinct clauses or restricted periods, so it’s vital to examine thoroughly all the information before taking advantage of them.
threesome photos
Welcome to our platform, where you can find exclusive content created exclusively for adults.
The entire collection available here is suitable for individuals who are over 18.
Make sure that you meet the age requirement before exploring further.
big cock
Enjoy a special selection of restricted materials, and dive in today!
MichealSnapy
Our platform features a wide range of prescription drugs for online purchase.
You can conveniently buy needed prescriptions with just a few clicks.
Our product list includes popular drugs and targeted therapies.
The full range is supplied through licensed suppliers.
cenforce 150 mg
We maintain discreet service, with secure payments and prompt delivery.
Whether you’re looking for daily supplements, you’ll find safe products here.
Begin shopping today and get reliable access to medicine.
WileyDeelT
One X Bet is a top-tier online betting platform.
With an extensive selection of sports, 1xBet meets the needs of countless users worldwide.
This 1XBet app crafted for both Android as well as iPhone users.
https://digitaldanish.in/pages/vosymoy_dom_v_goroskope_2.html
Players are able to get the 1xBet app via the platform’s page or Google’s store on Android devices.
iPhone customers, this software can be installed through the official iOS store with ease.
MichealSnapy
Our platform provides various pharmaceuticals for online purchase.
Users can easily get needed prescriptions from your device.
Our inventory includes both common treatments and targeted therapies.
Each item is acquired via licensed distributors.
vidalista 2.5mg
Our focus is on discreet service, with secure payments and timely service.
Whether you’re filling a prescription, you’ll find what you need here.
Begin shopping today and enjoy reliable support.
asian videos
Within this platform, find a wide selection adult videos.
Every video selected with care providing the best experience for users.
Searching for specific genres or just browsing, this site has something suitable for all.
teen photo
New videos are added regularly, ensuring available content always growing.
Entry to the full range limited for individuals aged 18+, ensuring compliance with applicable laws.
Stay tuned and fresh uploads, because the resource expands its library daily.
Jamesber
Здесь вы можете найти свежие бонусы Melbet-промо.
Используйте их во время создания аккаунта на платформе и получите до 100% на первый депозит.
Плюс ко всему, здесь представлены коды в рамках действующих программ игроков со стажем.
мелбет промокод при регистрации бонус
Обновляйте информацию в рубрике акций, не пропустив выгодные предложения для Мелбет.
Любой код обновляется на работоспособность, и обеспечивает безопасность при использовании.
StevenDor
On this site, you can easily find live video chats.
Whether you’re looking for friendly chats career-focused talks, the site offers a solution tailored to you.
Live communication module developed for bringing users together globally.
Delivering crisp visuals plus excellent acoustics, each interaction becomes engaging.
Participate in community hubs or start private chats, according to what suits you best.
https://rt.webcams.su/
The only thing needed a reliable network and a device to get started.
pin-up
Here, find an extensive selection internet-based casino sites.
Searching for well-known titles latest releases, you’ll find an option for any taste.
The listed platforms fully reviewed to ensure security, allowing users to gamble peace of mind.
free spins
Moreover, the site provides special rewards plus incentives for new players as well as regulars.
Due to simple access, discovering a suitable site takes just moments, making it convenient.
Stay updated on recent updates with frequent visits, as fresh options are added regularly.
бесплатно эро чат
Здесь вы можете найти видеообщение в реальном времени.
Если вы ищете увлекательные диалоги переговоры, здесь есть решения для каждого.
Функция видеочата предназначена для взаимодействия глобально.
порно чат семейный
За счет четких изображений плюс отличному аудио, любое общение остается живым.
Подключиться в общий чат или начать личный диалог, исходя из ваших предпочтений.
Все, что требуется — хорошая связь и любое поддерживаемое устройство, чтобы начать.
no depost
This website, you can access a great variety of casino slots from leading developers.
Visitors can try out retro-style games as well as feature-packed games with stunning graphics and interactive gameplay.
If you’re just starting out or a casino enthusiast, there’s always a slot to match your mood.
no depisit bonus
The games are available round the clock and optimized for laptops and smartphones alike.
No download is required, so you can get started without hassle.
Platform layout is intuitive, making it convenient to find your favorite slot.
Register now, and dive into the world of online slots!
1xbet
Here, you can discover a variety virtual gambling platforms.
Searching for well-known titles latest releases, you’ll find an option to suit all preferences.
Every casino included are verified for safety, enabling gamers to bet securely.
gambling
Additionally, this resource provides special rewards plus incentives targeted at first-timers and loyal customers.
With easy navigation, locating a preferred platform is quick and effortless, making it convenient.
Stay updated regarding new entries through regular check-ins, because updated platforms appear consistently.
aviator download
Aviator combines adventure with exciting rewards.
Jump into the cockpit and spin through turbulent skies for massive payouts.
With its vintage-inspired graphics, the game reflects the spirit of pioneering pilots.
https://www.linkedin.com/posts/robin-kh-150138202_aviator-game-download-activity-7295792143506321408-81HD/
Watch as the plane takes off – cash out before it flies away to grab your winnings.
Featuring smooth gameplay and realistic audio design, it’s a top choice for slot enthusiasts.
Whether you’re looking for fun, Aviator delivers non-stop action with every round.
舔阴
这个网站 提供 海量的 成人内容,满足 各类人群 的 兴趣。
无论您喜欢 哪种类型 的 内容,这里都 一应俱全。
所有 资源 都经过 严格审核,确保 高清晰 的 视觉享受。
A片
我们支持 不同平台 访问,包括 手机,随时随地 自由浏览。
加入我们,探索 绝妙体验 的 私密乐趣。
gambling
Here, find an extensive selection of online casinos.
Whether you’re looking for traditional options latest releases, there’s a choice for every player.
Every casino included are verified for safety, enabling gamers to bet peace of mind.
free spins
What’s more, this resource unique promotions along with offers targeted at first-timers as well as regulars.
With easy navigation, discovering a suitable site is quick and effortless, saving you time.
Be in the know regarding new entries through regular check-ins, since new casinos come on board often.
pin-up
Here, find an extensive selection virtual gambling platforms.
Whether you’re looking for traditional options or modern slots, there’s something to suit all preferences.
The listed platforms are verified to ensure security, allowing users to gamble securely.
play slots
What’s more, the platform offers exclusive bonuses plus incentives to welcome beginners and loyal customers.
With easy navigation, locating a preferred platform takes just moments, enhancing your experience.
Stay updated on recent updates through regular check-ins, as fresh options come on board often.
мега порно онлайн
Здесь вы найдете содержание 18+.
Контент подходит для личного просмотра.
У нас собраны множество категорий.
Платформа предлагает качественный контент.
порно русское смотреть онлайн бесплатно
Вход разрешен только для взрослых.
Наслаждайтесь эксклюзивным контентом.
Simonvew
У нас вы можете найти подготовительные ресурсы для учеников.
Предоставляем материалы по всем основным предметам включая естественные науки.
Успешно сдайте тесты с использованием пробных вариантов.
https://mybiysk.ru/life/gotovye-domashnie-zadaniya-polza-ili-vred-450013
Образцы задач помогут разобраться с темой.
Доступ свободный для комфортного использования.
Применяйте на уроках и достигайте отличных результатов.
Глаз Бога glazboga.net
Здесь доступен мессенджер-бот “Глаз Бога”, позволяющий найти сведения о гражданине по публичным данным.
Инструмент работает по номеру телефона, анализируя актуальные базы в сети. Благодаря ему доступны 5 бесплатных проверок и полный отчет по фото.
Сервис актуален на 2025 год и включает аудио-материалы. Глаз Бога гарантирует найти профили в соцсетях и покажет информацию в режиме реального времени.
бот Глаз Бога glazboga.net
Данный инструмент — помощник при поиске людей через Telegram.
StevenDor
Looking for exclusive 1xBet promo codes? Our platform offers working bonus codes like 1XRUN200 for registrations in 2025. Get up to 32,500 RUB as a welcome bonus.
Use official promo codes during registration to boost your bonuses. Enjoy no-deposit bonuses and exclusive deals tailored for casino games.
Discover monthly updated codes for global users with fast withdrawals.
All voucher is tested for validity.
Grab exclusive bonuses like 1x_12121 to increase winnings.
Active for new accounts only.
https://socialimarketing.com/story5214228/unlocking-1xbet-promo-codes-for-enhanced-betting-in-multiple-countriesKeep updated with 1xBet’s best promotions – enter codes like 1x_12121 at checkout.
Experience smooth benefits with easy redemption.
пробив номера телефона онлайн
В этом ресурсе вы можете получить доступ к боту “Глаз Бога” , который может получить всю информацию о любом человеке из открытых источников .
Данный сервис осуществляет поиск по номеру телефона и раскрывает данные из соцсетей .
С его помощью можно пробить данные через официальный сервис , используя фотографию в качестве ключевого параметра.
поиск машины по вин
Алгоритм “Глаз Бога” автоматически собирает информацию из проверенных ресурсов, формируя подробный отчет .
Пользователи бота получают ограниченное тестирование для тестирования возможностей .
Решение постоянно совершенствуется , сохраняя скорость обработки в соответствии с требованиями времени .
Davidbib
¿Necesitas códigos promocionales vigentes de 1xBet? En este sitio descubrirás recompensas especiales en apuestas deportivas .
El código 1x_12121 ofrece a 6500 RUB al registrarte .
También , canjea 1XRUN200 y disfruta un bono máximo de 32500 rublos .
https://rnopportunities.com/author/promocional03/
No te pierdas las promociones semanales para conseguir más beneficios .
Los promocódigos listados son verificados para esta semana.
No esperes y multiplica tus ganancias con la casa de apuestas líder !
пробив человека онлайн
Здесь вы можете найти боту “Глаз Бога” , который может проанализировать всю информацию о любом человеке из публичных данных.
Уникальный бот осуществляет поиск по номеру телефона и предоставляет детали из онлайн-платформ.
С его помощью можно узнать контакты через специализированную платформу, используя автомобильный номер в качестве ключевого параметра.
проверить машину по номеру
Система “Глаз Бога” автоматически анализирует информацию из множества источников , формируя структурированные данные .
Подписчики бота получают ограниченное тестирование для проверки эффективности.
Сервис постоянно обновляется , сохраняя скорость обработки в соответствии с законодательством РФ.
Edwardtap
На платформе доступен мощный бот “Глаз Бога” , который получает данные о любом человеке из проверенных платформ.
Инструмент позволяет идентифицировать человека по ФИО , раскрывая информацию из социальных сетей .
https://glazboga.net/
AP Royal Oak price
This platform features comprehensive information about Audemars Piguet Royal Oak watches, including market values and design features.
Explore data on iconic models like the 41mm Selfwinding in stainless steel or white gold, with prices averaging $39,939 .
The platform tracks resale values , where limited editions can sell for $140,000+ .
Piguet Royal Oak 15510 watches
Technical details such as water resistance are clearly outlined .
Get insights on 2025 price fluctuations, including the Royal Oak 15510ST’s retail jump to $39,939 .
MichaelUtete
LIMITED-TIME DEAL: ChatGPT PLUS/PRO at the LOWEST PRICE online!
GRAB YOUR SUBSCRIPTION NOW: ❣️ [url=https://bit.ly/UNLOCK-ChatGPT-PRO]ChatGPT PLUS/PRO[/url] ❣️
✅ WHY CHOOSE US?
✔ Instant activation – No waiting!
✔ Official subscription – No risk of bans!
✔ Cheaper than OpenAI’s website!
✔ Thousands of happy customers & 5-star reviews!
✔ 24/7 support – We’re here to help!
✅ HOW TO ORDER? (FAST & EASY!)
1️⃣ Click the link & select your plan.
2️⃣ Pay securely (Crypto, PayPal, Cards, etc.).
3️⃣ Receive your login OR unique activation code instantly!
4️⃣ Enjoy ChatGPT PLUS/PRO in minutes!
✅ WHAT’S INCLUDED?
⭐ GPT-4o (Fastest & Smartest AI!)
⭐ GPT-4 Turbo (Longer, detailed answers!)
⭐ Advanced AI features (Code Interpreter, Plugins, File Uploads!)
⭐ Priority access – No more downtime!
⚠ DON’T PAY FULL PRICE! Get ChatGPT PRO cheaper HERE:
❣️ [url=https://bit.ly/UNLOCK-ChatGPT-PRO]ChatGPT PLUS/PRO[/url] ❣️
⏳ DEAL ENDS SOON! Prices are rising—CLAIM YOUR SPOT NOW!
MatthewhoaGo
Сертификация и лицензии — обязательное условие ведения бизнеса в России, гарантирующий защиту от непрофессионалов.
Обязательная сертификация требуется для подтверждения безопасности товаров.
Для торговли, логистики, финансов необходимо получение лицензий.
https://ok.ru/group/70000034956977/topic/158832837638321
Игнорирование требований ведут к приостановке деятельности.
Дополнительные лицензии помогает повысить доверие бизнеса.
Своевременное оформление — залог легальной работы компании.
Mariomorne
Хотите найти подробную информацию для нумизматов ? Эта платформа предлагает исчерпывающие материалы погружения в тему нумизматики!
Здесь доступны коллекционные экземпляры из исторических периодов, а также драгоценные находки.
Изучите каталог с подробными описаниями и высококачественными фото , чтобы найти раритет.
монеты Армении
Если вы начинающий или эксперт, наши статьи и руководства помогут углубить экспертизу.
Не упустите шансом добавить в коллекцию эксклюзивные монеты с гарантией подлинности .
Присоединяйтесь сообщества энтузиастов и будьте в курсе аукционов в мире нумизматики.
Original Audemars Royal Oak 15710st reviews
Discover detailed information about the Audemars Piguet Royal Oak Offshore 15710ST via this platform , including pricing insights ranging from $34,566 to $36,200 for stainless steel models.
The 42mm timepiece boasts a robust design with automatic movement and rugged aesthetics, crafted in titanium.
https://ap15710st.superpodium.com
Check secondary market data , where limited editions command premiums , alongside pre-owned listings from the 1970s.
View real-time updates on availability, specifications, and resale performance , with trend reports for informed decisions.
Robertgaisp
Discover the iconic Patek Philippe Nautilus, a horological masterpiece that merges sporty elegance with exquisite craftsmanship .
Introduced nearly 50 years ago, this cult design revolutionized high-end sports watches, featuring distinctive octagonal bezels and horizontally grooved dials .
From stainless steel models like the 5990/1A-011 with a 55-hour energy retention to luxurious white gold editions such as the 5811/1G-001 with a azure-toned face, the Nautilus suits both avid enthusiasts and casual admirers.
Verified Philippe Nautilus 5711 timepieces
Certain diamond-adorned versions elevate the design with dazzling bezels , adding unmatched glamour to the timeless profile.
According to recent indices like the 5726/1A-014 at ~$106,000, the Nautilus remains a coveted investment in the world of luxury horology .
For those pursuing a historical model or contemporary iteration , the Nautilus epitomizes Patek Philippe’s legacy of excellence .
EddieDuect
Designed by Gerald Genta, revolutionized luxury watchmaking with its iconic octagonal bezel and bold integration of sporty elegance.
Available in classic stainless steel to skeleton dials , the collection combines avant-garde design with precision engineering .
Starting at $20,000 to over $400,000, these timepieces attract both luxury enthusiasts and newcomers seeking wearable heritage.
Certified Audemars Piguet Oak 26240 wristwatches
The Perpetual Calendar models set benchmarks with robust case constructions, showcasing Audemars Piguet’s relentless innovation.
Thanks to ultra-thin calibers like the 2385, each watch reflects the brand’s commitment to excellence .
Explore certified pre-owned editions and detailed collector guides to elevate your collection with this timeless icon .
Peterdyemo
Die Royal Oak 16202ST kombiniert ein 39-mm-Edelstahlgehäuse mit einem ultradünnen Design von nur 8,1 mm Dicke.
Ihr Herzstück bildet das neue Kaliber 7121 mit 55 Stunden Gangreserve.
Der blaue „Bleu Nuit“-Ton des Zifferblatts wird durch das Petite-Tapisserie-Muster und die kratzfeste Saphirscheibe mit Antireflexbeschichtung betont.
Neben klassischer Zeitmessung bietet die Uhr ein Datumsfenster bei 3 Uhr.
15450st royal oak
Die bis 5 ATM geschützte Konstruktion macht sie für sportliche Einsätze geeignet.
Das integrierte Edelstahlarmband mit verstellbarem Dornschließe und die achtseitige Rahmenform zitieren das ikonische Royal-Oak-Erbe aus den 1970er Jahren.
Als Teil der legendären Extra-Thin-Reihe verkörpert die 16202ST horlogerie-Tradition mit einem Wertanlage für Sammler.
TyroneSmate
Эта платформа собирает важные новостные материалы разных сфер.
Здесь представлены аналитика, бизнесе и многом другом.
Контент пополняется ежедневно, что позволяет не пропустить важное.
Минималистичный дизайн помогает быстро ориентироваться.
https://podium24.ru
Любой материал предлагаются с фактчеком.
Целью сайта является объективности.
Присоединяйтесь к читателям, чтобы быть на волне новостей.
patek-philippe-nautilus.ru
Коллекция Nautilus, созданная мастером дизайна Жеральдом Гентой, сочетает спортивный дух и высокое часовое мастерство. Модель Nautilus 5711 с самозаводящимся механизмом имеет 45-часовой запас хода и корпус из белого золота.
Восьмиугольный безель с округлыми гранями и синий солнечный циферблат подчеркивают уникальность модели. Браслет с интегрированными звеньями обеспечивает удобную посадку даже при активном образе жизни.
Часы оснащены индикацией числа в позиции 3 часа и антибликовым покрытием.
Для сложных модификаций доступны хронограф, лунофаза и функция Travel Time.
patek-philippe-nautilus.ru
Например, модель 5712/1R-001 из красного золота 18K с механизмом на 265 деталей и запасом хода на двое суток.
Nautilus остается предметом коллекционирования, объединяя инновации и традиции швейцарского часового дела.
установка видеонаблюдения организации
Размещение систем видеонаблюдения обеспечит контроль вашего объекта в режиме 24/7.
Инновационные решения гарантируют высокое качество изображения даже в ночных условиях.
Вы можете заказать широкий выбор устройств, идеальных для офиса.
фирма по установке видеонаблюдения
Грамотная настройка и консультации специалистов обеспечивают простым и надежным для любых задач.
Оставьте заявку, для получения персональную консультацию для установки видеонаблюдения.
глаз бога ссылка
На данном сайте доступен сервис “Глаз Бога”, который найти сведения о гражданине из открытых источников.
Сервис функционирует по ФИО, используя доступные данные онлайн. С его помощью доступны 5 бесплатных проверок и полный отчет по имени.
Инструмент актуален на 2025 год и включает аудио-материалы. Глаз Бога гарантирует узнать данные в открытых базах и предоставит сведения за секунды.
глаз бога телеграмм официальный бот
Такой сервис — выбор для проверки персон через Telegram.
глаз бога бот
Здесь можно получить сервис “Глаз Бога”, который проверить всю информацию о гражданине из открытых источников.
Инструмент функционирует по фото, анализируя доступные данные в Рунете. С его помощью осуществляется бесплатный поиск и детальный анализ по фото.
Инструмент проверен на 2025 год и поддерживает мультимедийные данные. Бот сможет узнать данные в открытых базах и предоставит сведения за секунды.
глаз бога пробить человека
Данный инструмент — идеальное решение при поиске людей онлайн.
RonaldJethy
Looking for free online games ? This site offers a diverse library of casual puzzles and strategy challenges.
Explore cooperative missions with global players , supported by intuitive chat tools for seamless teamwork.
Access user-friendly interfaces designed for effortless navigation , alongside parental controls for secure play.
online casino nz
From sports simulations to creative builders, every game prioritizes fun and emotional rewards.
Unlock premium upgrades that let you earn in-game perks, with subscription models for deeper access.
Join of a thriving community where teamwork flourishes , and stay active through immersive storytelling.
zaimi bez otkaza_swOl
взять микрозайм срочно без отказа [url=zajm-bez-otkaza-1.ru]взять микрозайм срочно без отказа[/url] .
Lloydinver
Хотите собрать информацию о пользователе? Наш сервис поможет детальный отчет в режиме реального времени .
Используйте уникальные алгоритмы для анализа публичных записей в открытых источниках.
Выясните место работы или интересы через систему мониторинга с верификацией результатов.
глаз бога по номеру телефона
Система функционирует с соблюдением GDPR, обрабатывая общедоступную информацию.
Получите расширенный отчет с историей аккаунтов и списком связей.
Доверьтесь проверенному решению для digital-расследований — результаты вас удивят !
Michaelirref
Наш сервис поможет получить данные о любом человеке .
Укажите никнейм в соцсетях, чтобы получить сведения .
Система анализирует открытые источники и цифровые следы.
глаз бога официальный бот
Результаты формируются в реальном времени с фильтрацией мусора.
Идеально подходит для анализа профилей перед сотрудничеством .
Анонимность и актуальность информации — гарантированы.
BarryWep
Этот бот способен найти информацию по заданному профилю.
Достаточно ввести никнейм в соцсетях, чтобы сформировать отчёт.
Система анализирует открытые источники и активность в сети .
глаз бога тг
Информация обновляется в реальном времени с проверкой достоверности .
Идеально подходит для проверки партнёров перед сотрудничеством .
Анонимность и актуальность информации — гарантированы.
psihiatr_etKa
получить консультацию психиатра [url=https://psihiatry-nn-1.ru]https://psihiatry-nn-1.ru[/url] .
Lloydinver
Хотите найти данные о человеке ? Этот бот поможет полный профиль мгновенно.
Используйте уникальные алгоритмы для поиска цифровых следов в соцсетях .
Выясните контактные данные или активность через автоматизированный скан с верификацией результатов.
сервис глаз бога
Бот работает с соблюдением GDPR, обрабатывая общедоступную информацию.
Получите расширенный отчет с геолокационными метками и графиками активности .
Попробуйте проверенному решению для исследований — результаты вас удивят !
Michaelirref
На данном сайте предоставляется сведения по любому лицу, в том числе полные анкеты.
Базы данных охватывают персон любой возрастной категории, статусов.
Данные агрегируются из открытых источников, подтверждая достоверность.
Поиск выполняется по имени, что обеспечивает использование удобным.
глаз бога актуальный бот
Также предоставляются адреса и другая актуальные данные.
Все запросы проводятся в соответствии с правовых норм, предотвращая утечек.
Воспользуйтесь данному ресурсу, в целях получения необходимую информацию в кратчайшие сроки.
Michaelirref
Здесь можно найти сведения по любому лицу, от кратких контактов до полные анкеты.
Архивы содержат людей разного возраста, статусов.
Сведения формируются на основе публичных данных, что гарантирует точность.
Поиск выполняется по фамилии, что делает работу быстрым.
тг канал глаз бога
Также предоставляются адреса и другая важные сведения.
Работа с информацией выполняются в соответствии с правовых норм, обеспечивая защиту несанкционированного доступа.
Воспользуйтесь данному ресурсу, чтобы найти необходимую информацию в кратчайшие сроки.
MarvinCag
При выборе семейного доктора стоит обратить внимание на его опыт , умение слушать и удобные часы приема.
Проверьте , что медицинский центр расположена рядом и сотрудничает с узкими специалистами.
Спросите, принимает ли врач с вашей страховой компанией , и какова загруженность расписания.
https://1fckyjov-staripani.cz/index.php/forum/soupisky/128#545615
Обращайте внимание рекомендации знакомых, чтобы оценить отношение к клиентам.
Важно проверить сертификацию врача , аккредитацию клиники для уверенности в качестве лечения.
Оптимальный вариант — тот, где вас услышат ваши особенности здоровья, а общение с персоналом будет максимально прозрачным.
Michaelirref
Здесь можно найти сведения о любом человеке, от кратких контактов до полные анкеты.
Реестры включают граждан разного возраста, профессий.
Сведения формируются по официальным записям, что гарантирует достоверность.
Нахождение осуществляется по имени, сделав использование удобным.
телеграм бот глаз бога проверка
Также предоставляются адреса а также полезная информация.
Все запросы обрабатываются с соблюдением норм права, предотвращая разглашения.
Обратитесь к данному ресурсу, в целях получения необходимую информацию без лишних усилий.